
Building DEI in higher education can improve your institution’s reputation, and it’s critical to recruiting and retaining students, faculty, and staff. But it’s difficult to measure the impact of DEI initiatives, leading to inaction, focusing on the wrong efforts, or an inability to provide the right resources to those who need them most.
So, how can you measure the success of DEI efforts at your institution?
This article will show you:
- Where to find DEI-related data for students, faculty, & at an institution-level
- How to use the data to find strengths & weaknesses
- Ways to take action & measure success

Start by gathering the right data
DEI-related data comes from different sources. Some data, like student demographics, likely exist, while other data will need to be gathered.
We’ll summarize common types of data to collect for:
- Students
- Faculty & staff
- Institutions
Use admissions information to gather student demographic data such as gender, race, ethnicity, and age. And collect data about student disabilities and conditions, which can impact how online education is delivered and identifies differing needs for assistive devices.
Academic performance data, correlated with demographic data, can shed light on the students or groups that are more or less likely to succeed. This information can help identify opportunities to implement new DEI initiatives that support student success.
You find that 20% of your total student population and 35% of your online students have disabilities that impact their ability to engage, interact, and learn.
After analyzing their performance, you find that online students with disabilities achieve lower grades than those who attend classes on campus.
The lower grade could be due to course curriculum, but it could also be tied to accessibility issues online students encounter that can negatively impact their performance.
Without asking for it, most students don’t share the impact of DEI efforts with institutions. Conduct regular student surveys to understand experiences, opinions, ideas, and awareness of DEI initiatives.
Surveys help understand why students choose a particular university or why they decided to leave – both could be related to DEI.
Compensation data should be readily available within HR and accounting systems. Gathering this information can highlight potential gaps or biases and should be part of this initial audit.
However, it’s important not to jump to conclusions based on compensation alone. When evaluating compensation differences, leaders must take into account any outlying factors tied to individual compensation packages.
A compensation analysis shows that some female instructors in the business
department aren’t compensated as well as male instructors with similar years of employment at the institution. Additionally, after digging in further, you find that Black females in particular are compensated less than White females.
Other factors that can impact compensation include performance, the number of classes each instructor teaches, departmental research grants and donations, and fundraising, among other factors.
Understanding this information helps determine whether gaps in compensation are due to potential bias or not. In this scenario, start by looking at individual performance reviews for the department’s female and male instructors with similar years of experience and who teach the same number of classes. Look into the other factors listed above. If all factors are equal except salary, this may point to a bias.

Scenario A: 12% of the female performance review scores were below average, while only 10% of male performance reviews were below average.
In this scenario, the difference between the percentage of females and males who received below-average scores is relatively small. While these scores may not be the sole reason behind the compensation gap, they could be a contributing factor.
Consider the individuals or teams behind the reviews. Are they judging individuals differently based on biased beliefs that cause lower scores for one segment?
Scenario B: 45% of White females received above-average performance reviews, and 37% of Black females received the same.
The percentages in Scenario B is significant, which could indicate potential bias against Black female instructors. Dig into this information to determine what factors may be contributing to the compensation gap. True performance is acceptable, but inherent biases against capability related to race are not.
Most institutions have faculty and staff demographic data available within the systems used for HR purposes.
Understanding demographic information at every level is important because an institution may have a diverse workforce as a whole but still struggle in key areas, like diversity in positions of leadership. An institution may be diverse in terms of race or ethnicity, but there could also be gaps in the number of male and female employees.
It’s important to understand if an institution’s leadership team is truly diverse. Gather data around employee demographics and positions of leadership to identify any gaps that exist in leadership roles.
This information could be tricky to gather, depending on the level of past DEI training. Some institutions use the LMS to test knowledge based on information covered during training, but others may consider watching a video as training.
- Number & frequency of DEI-specific training sessions
- Number of hours total each quarter/year
- Scores & ratings for DEI training exams
- % of employees that completed DEI training
- % of managers that completed DEI training
- % of senior leadership that completed DEI training
Like with students, conducting surveys regularly with faculty and staff helps understand opinions, expectations, awareness, and understanding of DEI efforts. It uncovers information that might not otherwise be available and gives employees a voice in developing DEI initiatives that meet their needs.
- Department or college within the institution
- Specific roles
- All employees
Aside from the data for students, faculty and staff, leaders should also look to gather institutional information that can be used to improve DEI efforts.
Data from operational and institutional efforts can help teams understand the financial impact of DEI initiatives, the gaps that exist, and the allocated budget.
Gather data about the average spend on DEI initiatives each year.
- % of the budget spent on DEI
- % increase or decrease of DEI-related spending year-over-year
- Spending allocation (ex. employee training, campus events for students, third-party research, etc.)
- How do DEI initiatives impact the recruitment and retention of students and employees?
- Have those areas seen improvements? If so, what’s the financial impact?
Example: DEI may improve employee engagement, which can lead to better retention rates. How much does this save in reduced turnover and new employee training? Evaluate and measure every aspect of improvement DEI creates.
Look at the percentage of diverse candidates and how they progress through different levels in the hiring process.
- Level 1: Diverse candidates in the total pool of candidates
- Level 2: Diverse candidates receiving interviews
- Level 3: Diverse candidates that receive job offers
- Level 4: Diverse candidates that accept job offers
Next, determine which levels need to improve and which are in good standing. Set realistic goals to maintain and improve these levels, starting with the lower levels.
The examples below are a brief look at data to gather about the retention of diverse employees and leaders. Are there any areas of employee retention that are weaker than others? If yes, dig into why.
- Employees who leave the institution before [number] days.
- Employees that have been at the institution for at least [number] months/years.
- Leaders who leave the institution before [number] days/months.
- Leaders who have been at the institution for at least [number] months/years.
Find strengths & weaknesses
After gathering the data you need data, look at your strengths and weaknesses.
- Do student surveys indicate that all students feel welcomed and included?
- Are there compensation gaps for certain groups of employees?
- Is the student population diverse? Is it diverse in a balanced way?
- Are faculty members trained properly?
- Is the leadership team diverse?
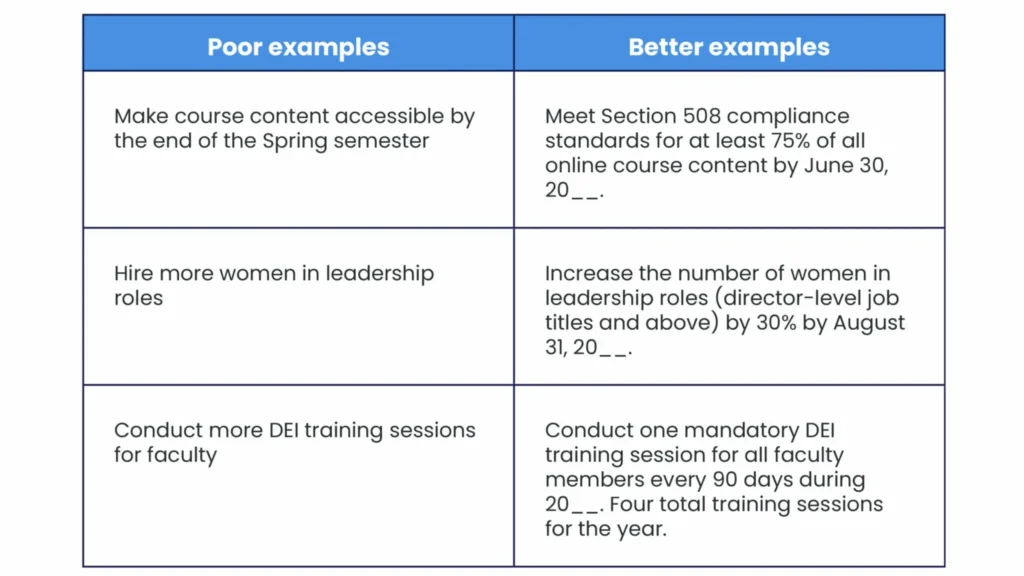
Once a bigger picture of DEI initiatives emerges, the next step is to set goals that outline where the institution should be and the potential impact of achieving this desired state. It’s important to be specific and realistic about goals, milestones, and timelines.
After identifying what’s working and what needs improvement, focus on the areas of opportunity. How can these be addressed in order to meet the DEI goals?
For this example, assume that the data indicates two things about online students:
- 85% feel welcomed and included because of the student orientation
- 35% believe that the online course content doesn’t isn’t accessible
Overall, the student orientation is in good standing, but real priority is improving the accessibility of online course content. You’ll see in the steps below that efforts for each can benefit the other.
1. Make quick accessibility updates while planning longer-term efforts. LMS admins can make changes to global LMS settings that impact the online course experience for a large number of students, such as:
- LMS colors to meet contrast ratio compliance standards
- Adjusting keyboard functions to make page navigation more efficient
While the quicker changes are being implemented, prepare longer-term efforts, such as:
- Progressive faculty training about how to create accessible course content
- Continually developing accessibility-related resources that faculty can use while creating content in the future
While 85% of students indicated that the orientation process made them feel welcomed and included, there are likely still some ways to improve. Adding questions about accessibility to the surveys can help students see that their well-being and needs are important, right from the beginning of their relationship with the institution.
- Gathering information about how to improve the student orientation
- Better understanding of student accessibility needs
DEI measurement in action
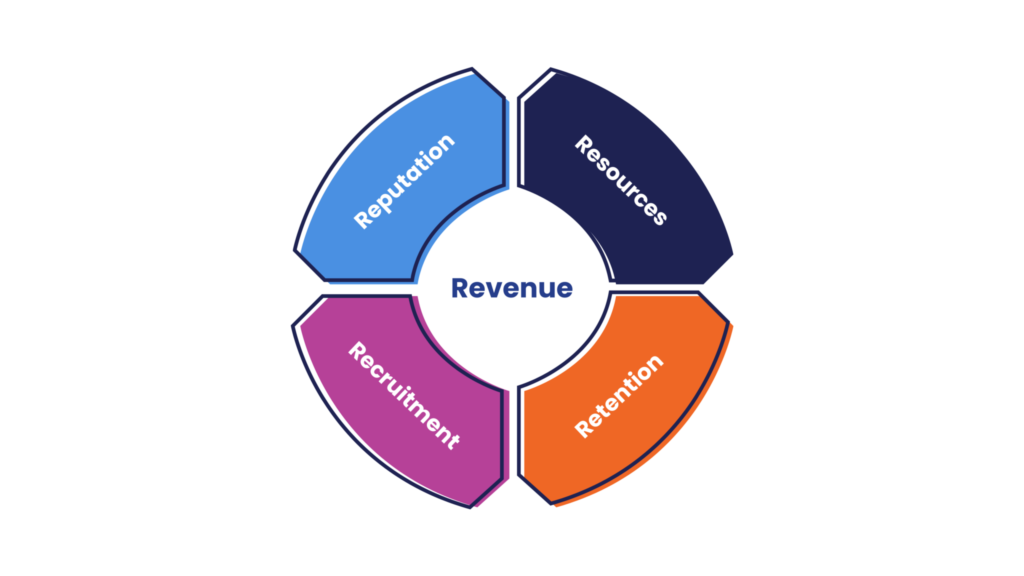
Measurement goes beyond just analyzing the impact of DEI initiatives. Collecting and analyzing the right data provides valuable insight to help refine and improve initiatives that directly impact reputation, recruitment, retention, resources, and revenue – the 5 Rs.
Ultimately, allowing institutions to deliver an exceptional educational experience for students and an elevated teaching experience for instructors.
Read our recent blog if you’re wondering what to expect from educational technology and online learning in the near future.